Blog
How to Create Your Own Repair vs. Replace Graph
By Service Excellence Training • How to Create Your Own Repair vs. Replace GraphWhat is a Repair vs. Replace Graph?
A repair vs. replace graph is a graph that home service technicians and salespeople can use to communicate to clients when a product should be replaced or when it should be repaired based on the age of their existing product and the cost of a newly installed product. When a graph is made, there is a curved line that goes through it. Anything above the curve means the product should be replaced and anything below it means the client should get the product repaired.
How Do I Make a Repair vs. Replace Graph?
It might seem intimidating at first, but creating a repair vs. replace graph is actually pretty simple because you only have two variables to worry about: money and time. Here’s how to do it step by step:
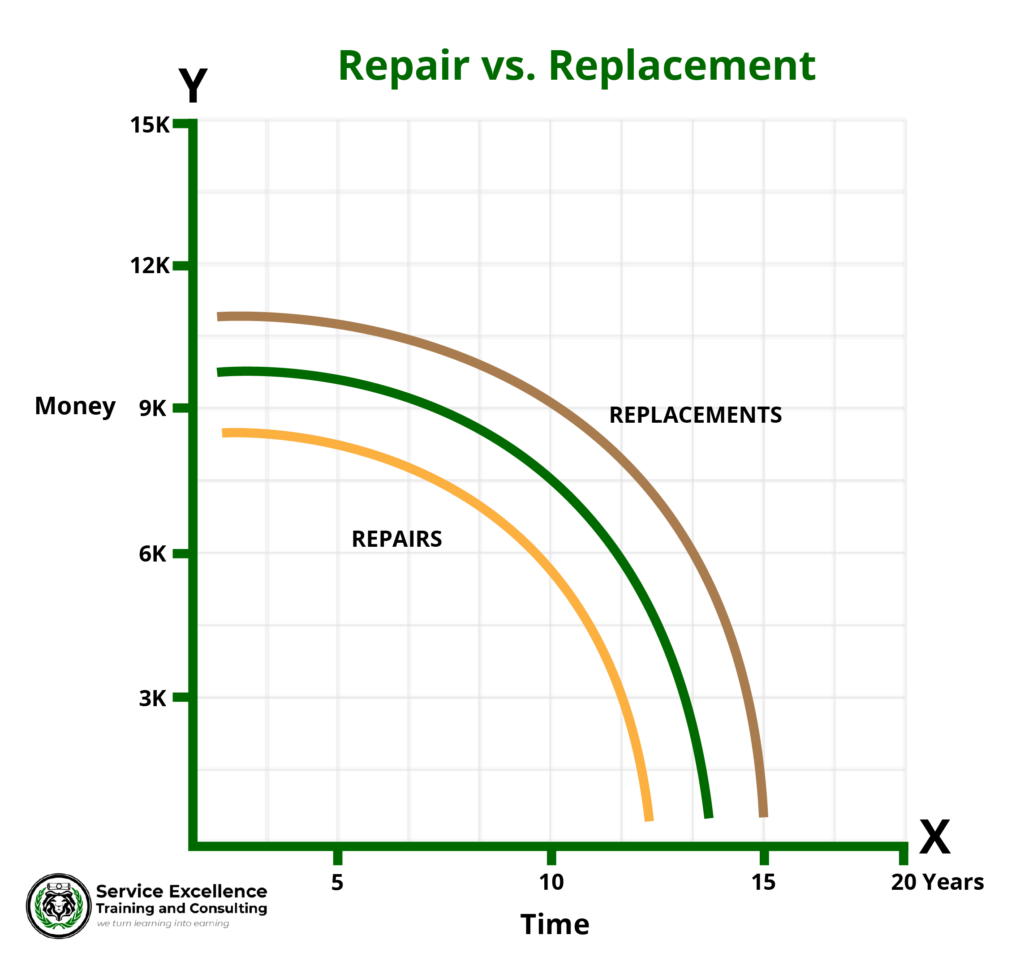
Step 1: Draw a graph with an X-axis and a Y-axis.
Step 2: Label your Y-axis, or your vertical axis, ‘Money’ and label your X-axis, or your horizontal axis, ‘time.’
Step 3: Calculate the max cost your product replacement could be. Include the installation costs and fees associated with this product. This will vary depending on the product and cost of installation. For this example, we are assuming the max replacement cost is $15,000. Write your max replacement cost at the very top of your Y-axis.
Step 4: Identify the maximum lifespan of your product. Some external variables can affect this number. For example, an HVAC unit in Houston will likely have a shorter lifespan than the same unit in Chicago. For this example, our product’s max lifespan is 20 years. Once you find your product’s max lifespan, write it at the far right end of your X-axis.
Step 5: Typically, the younger a product is, the more money a client is going to be willing to spend on repairs. Identify how much a client would be willing to spend on repairs for each year (or a couple of years if you don’t feel like getting into the nitty-gritty) within the lifespan of your product.
Step 6: Once you find out how much a client is willing to spend on repairs based on the age of the product, plot your data points on the graph. The data points should form a curved line.
Step 7: Use the graph when making sales. Any price/time data points that fall beneath the curve qualify as a repair and anything above the curve generally warrants a replacement.
How Can a Repair vs. Replace Graph Help My Business?
Whether it’s a roof, a water heater, an HVAC unit or anything in between, you should get a general idea of what homeowners are willing to spend on your products and services. Some of the benefits of having an in house repair vs. replace graph include:
- Build Trust Through Transparency: Being transparent about the numbers from the start helps build a sense of trust between you and the client. Letting them know that you are working in their best interest means they are more likely to go forward with your services and offerings.
- Don’t Leave Money on the Table: If you recommend a repair when you really should be recommending a replacement, there is money left on the table. Having this chart will help you identify when you should be recommending replacements over repairs.
- Provide More Reliable Services: When products get older they naturally need more and more repairs. Having a resource to show your clients when it is recommended to replace their product rather than continuously repair it helps them get a better idea of what to expect from your services. If you recommend a replacement but they still choose to go with a repair and the product then breaks down a few months later, you gave them an accurate prediction.
- Strength in Numbers: Showing your clients how much their fellow homeowners are willing to spend on repairs and replacements gives more credibility to your sales pitch. Showing them that more people are willing to replace rather than spend Y amount of money after X amount of years on a repair might encourage them to make that purchase.
If you want help setting up your very own repair vs. replacement graph, or if you want to learn more sales techniques, you should check out one of our upcoming classes or one of our monthly memberships.
Upcoming PRESS PLAY Classes
Sales
Technicians
CSRs
Managers
Owners
Ready to turn your learning into earning? Inquire about our classroom training.
What SETs Us Apart?
Proactive Business Plans
A proactive business is a successful business. That's why our team takes the time to make sure every client has a proactive, not reactive, business plan. Our strategies make your business run more smoothly and profitable.
Proven Results
Our training services help businesses identify and achieve their key performance indicators (KPIs). Whether it's increased revenue or higher satisfaction rates, our methods allow you to see immediate and continued results.
Personalized Training
Our team of experts works hard to make sure your business gets personalized training. We'll work with your team one-on-one or in group settings to set and achieve your business goals. We develop training based on your goals!
Prioritizing People
We believe that people are the most valuable asset. We strive to provide outstanding benefits, life balance, leadership, and support to our team. We believe in helping people reach their greatest level of growth, contribution and satisfaction.

Success Stories
I've increased my sales from $250,000 a year to over $400,00! This really works.
-Scott Putman, Putman Plumbing
Success Stories
Over $2,400,000 in sales my second year after training with SET!
-Chris Yanez, Selling Tech
Success Stories
I sold $18,867 on my first call after SET's Press Play for Sales event series!
-Jake Pettit, Selling Tech
Success Stories
We have been with Service Excellence Training since 2015 and believe it is an integral part (training, coaching, mentoring) to our overall business model.
-Judy Mueller-Hyde, Director of OperationsTrusted By


Business Ignition
SPARK
Classroom Training
Resources
Company
Join our newsletter